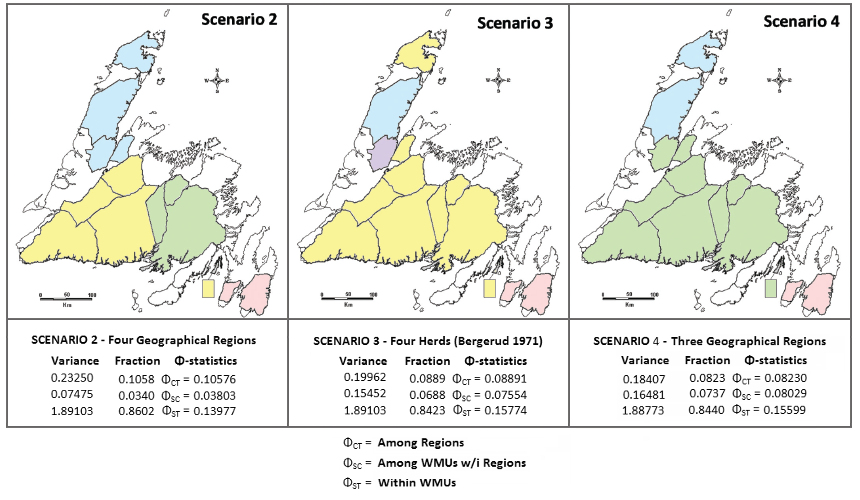
Grouped geographical regions tested as herds in AMOVA analyses
Wildlife Management Unit (WMU) names are color-coded as three models of herd structure in Caribou (a total of five were examined). Scenario 3 is the a priori model of herd management, based on migration patterns observed by Bergerud (1971). Bergerud recognized a single herd in Central Newfoundland, allowed for the relatively recent introduction of caribou from Central into St Anthony at the tip of the Northern Peninsula, and onto Merasheen Island, Placentia Bay. Scenario 2 divides Central Newfoundland into western and eastern herds, and treats the Great Northern Peninsula as a single herd. Scenario 4 unifies Central Newfoundland, and re-defines the Great Northern Peninsula herd. All models recognize the Avalon Herd as separate. On the TCH Narrows between the Avalon and the rest of the island, observe the thick growth of lichen: there are no signs of migratory grazing caribou.
An Analysis of Molecular Variance (AMOVA) is analogous to an Analysis of Variance (ANOVA), allowing for the peculiarities of molecular data (e.g., here the data are haploid mitochondrial DNA sequence frequencies). The AMOVA partition of genetic variance within, among, and across WMUs indicates structure. In essence, F is treated as a variance component, and is partitioned among different groupings of WMUs in each model. Models with a high degree of ØCT structure are of special interest.
The notation of an AMOVA with haploid mtDNA data is different than with diploid allozyme or nucDNA data. ØCT is equivalent to FST, ØSC is equivalent to FIS, and ØST is equivalent to FIT. Scenario 2 shows the highest variance among herds (ØCT = 0.106), and minimal variance within herds (ØSC = 0.038). Scenarios 3 & 4 show the contrasting patterns (ØCT = 0.08 ~ 0.09, and ØSC ~ 0.08 ).
After Figure 5 from Wilkerson et al. 2018; Text material © 2025 by Steven M. Carr