Estimation of selection
coefficients for the HbS allele
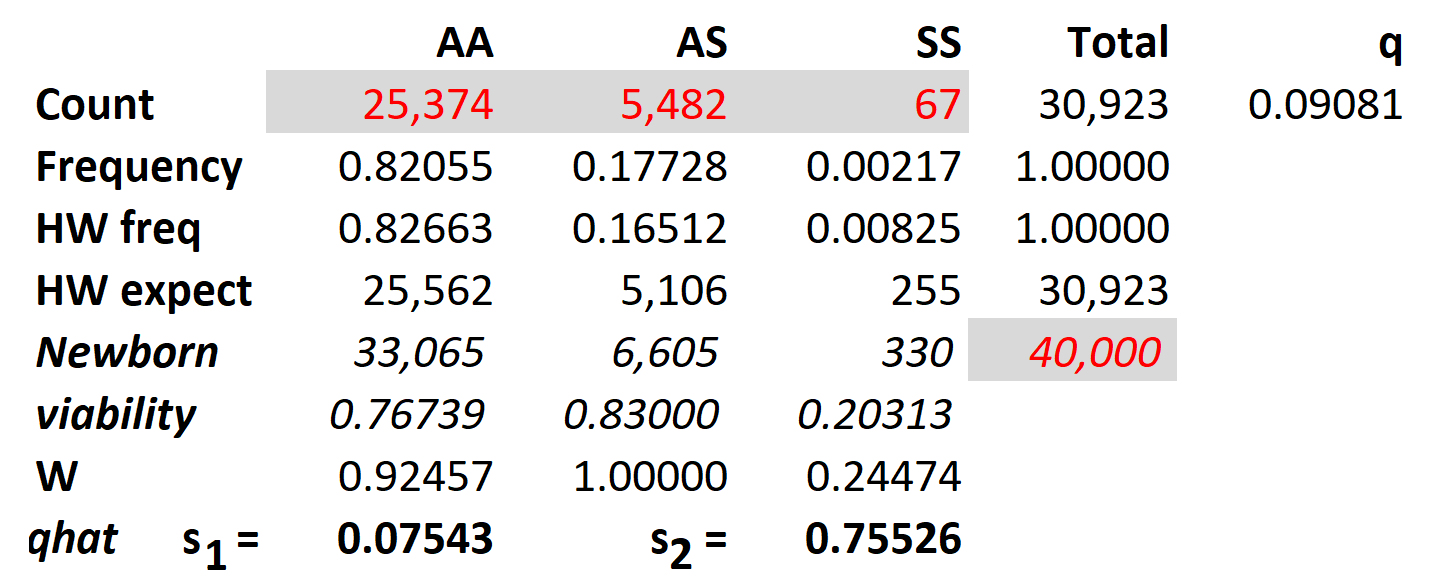
The data above record the
numbers of persons in an African population with Standard,
Trait, and Sickle-Cell phenotypes as
determined by their AA, AS, and SS genotypes.
These data allow calculation of the relative Fitness values
of the three phenotypes, the selection coefficients
(s1 and s2)
of the SS and AA genotypes,
and equilibrium frequency q = f(S).
HOMEWORK: A recent survey of 56,000 hospitalized patients in one Middle Eastern country identified 1,120 with sickle-cell disease (SS) and 13,440 with sickle-cell trait (AS). From these numbers and the formulae above, calculate the table values and estimate the selection coefficients against AA and SS. Calculate the expected equilibrium frequency of q. Test by Chi-square whether the adult population shows expected Hardy-Weinberg proportions.
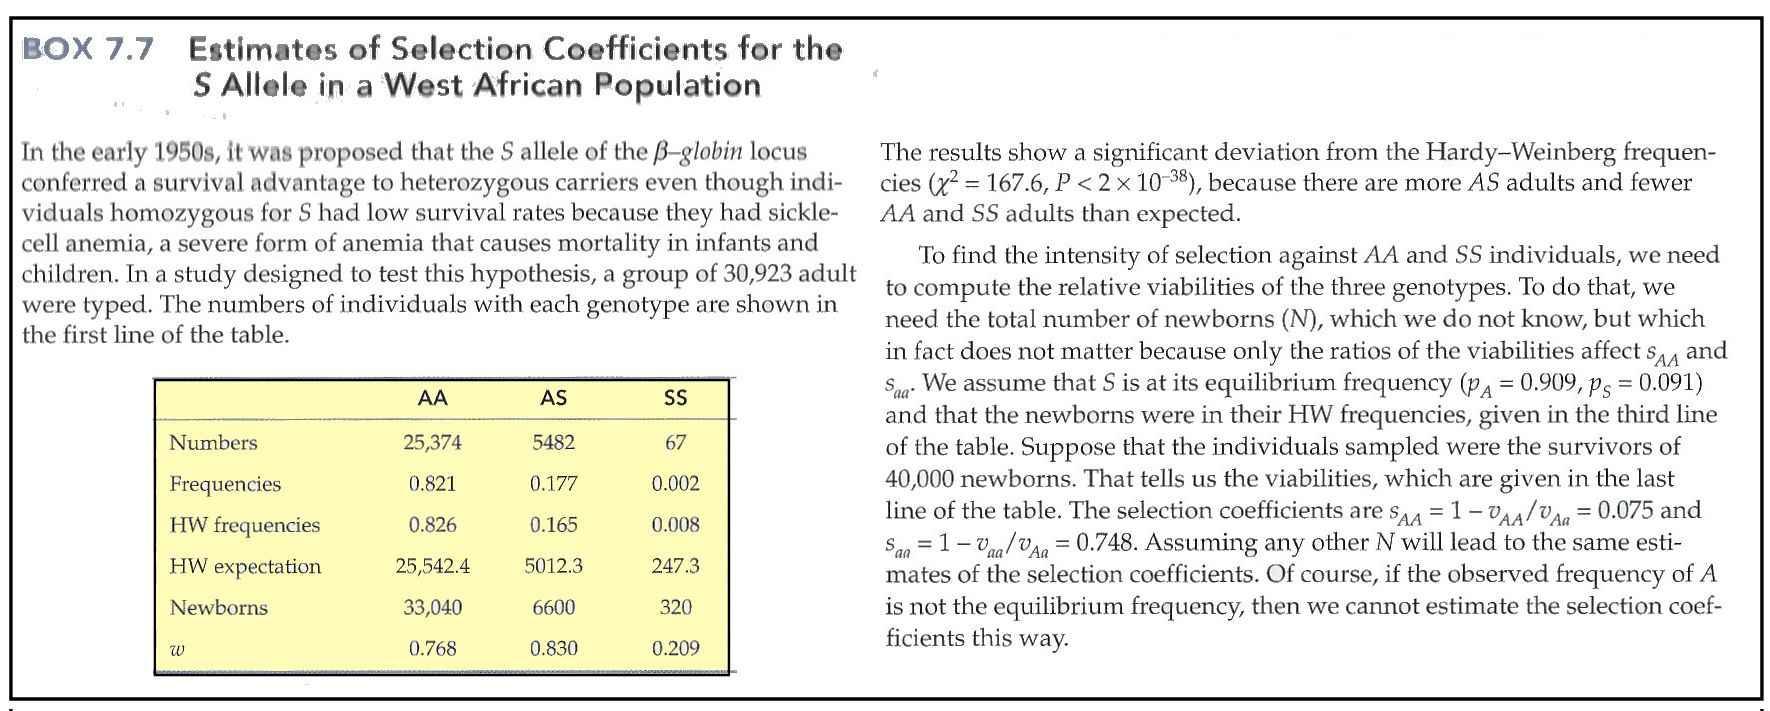
SS Note: Box 7.7 from Nielsen & Slatkin 2013 [below] includes a miscalculation that leads to several errors in the results. Compare that calculation with the one above: what is the probable cause of the error? How could it be prevented?
HOMEWORK: A recent survey of 56,000 hospitalized patients in one Middle Eastern country identified 1,120 with sickle-cell disease (SS) and 13,440 with sickle-cell trait (AS). From these numbers and the formulae above, calculate the table values and estimate the selection coefficients against AA and SS. Calculate the expected equilibrium frequency of q. Test by Chi-square whether the adult population shows expected Hardy-Weinberg proportions.
SS Note: Box 7.7 from Nielsen & Slatkin 2013 [below] includes a miscalculation that leads to several errors in the results. Compare that calculation with the one above: what is the probable cause of the error? How could it be prevented?
Figure © 2013 by Sinauer; Text material © 2021 by Steven M. Carr