
The Site Frequency Spectrum (SFS) as a description of allelic variation
The sample data set
shows 10bp sequences from five
individuals, including three that show SNP variability.
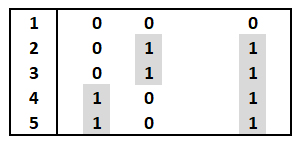
The binary-coded
data matrix [left] shows the
occurrence of these three variable sites among
five individuals, coded as 0 or 1,
to indicate whether each SNP site in each
individual has the same base as Individual 1
(hence ancestral) or not (hence derived).
These data define three alleles
(haplotypes), found in individuals ## (1), (2
& 3), and (4 & 5). Recall the
assumption that Individual 1
shows the ancestral state
(0) at all three positions, and
various of the other individuals the derived
state (1).
The derived forms of the three
SNP sites occurs in 2/5, 2/5, and 4/5
individuals, respectively, as shown by shading.
With n individuals, the derived allele could occur in 1, 2, 3, ... (n-1) individuals, which establishes (n-1) classes, in this case 5 - 1 = 4 classes as shown. [They are called "allele frequencies" because they correspond to SNP variants in 20%, 40%, 60%, or 80% of the individuals]. The SFS graph summarizes the allele frequency data 2/5, 2/5, and 4/5 by showing that 2/3 = 67% of the SNPs occur in two individuals, and that 1/3 = 33% occurs in one individual. Note that the data show no cases where the derived allele is present in only 1 or in 3 individuals.
Advanced: The SFS can also be written for n individuals as a vector f = (f1, f2, ..., fn-1), in this case f = (0.0, 0.67, 0.0, 0.33). If the ancestral and derived SNPs at each position are not known, we can write a folded frequency spectrum vector, by combining ("folding") sites with 10000 + 01111 and 11000 + 00111 SNP distributions ( "1+4" and "2+3" patterns). In this case, the folded vector is f* = (f1, f2) = (0.33, 0.67). Observe that if there were n = 6 individuals, and there were a fourth site coded from top to bottom as 000111 or 111000 ("3+3" pattern), it would be possible to write a folded vector f* = (f1, f2, f3) = (0.25, 0.50, 0.25).
For n=5 as in the example, the notation for a folded vector doesn't define an f*3 term if the series is limited to f*j < n/2 < 5/2 = 2.5. In English, any odd number 2n+1 has the same number of allele frequency classes as the next lower even number 2n.
Figure © 2013 by Sinauer; Text material © 2017 by Steven M. Carr