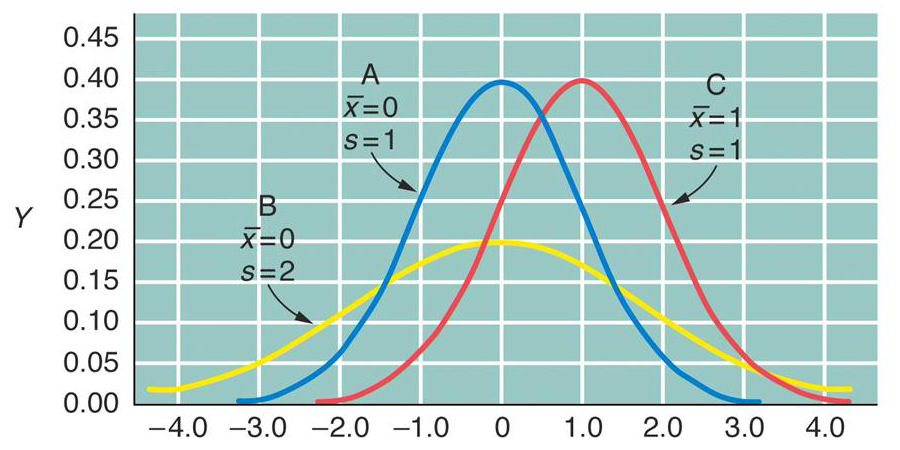
Three Normal Distributions
A
normal distribution is
described by its mean ( , read as "x bar")
and standard deviation
(s), as ± s. The interval between ±1
s
always includes 68.27%
of the area under the curve, ±2
s includes 95.45%,
and ±3
s includes 99.73%.
Alternatively, 50% of
the area lies between ±0.674 s, 95% between ±1.960
s, and 99% between
±2.576
s. This is true whether the distribution is tall (A)
or wide (B) or offset to a higher mean (C).
[The parametric mean and standard deviation are written µ ±
, read as "x bar")
and standard deviation
(s), as ± s. The interval between ±1
s
always includes 68.27%
of the area under the curve, ±2
s includes 95.45%,
and ±3
s includes 99.73%.
Alternatively, 50% of
the area lies between ±0.674 s, 95% between ±1.960
s, and 99% between
±2.576
s. This is true whether the distribution is tall (A)
or wide (B) or offset to a higher mean (C).
[The parametric mean and standard deviation are written µ ±  ].
].
, read as "x bar")
and standard deviation
(s), as ± s. The interval between ±1
s
always includes 68.27%
of the area under the curve, ±2
s includes 95.45%,
and ±3
s includes 99.73%.
Alternatively, 50% of
the area lies between ±0.674 s, 95% between ±1.960
s, and 99% between
±2.576
s. This is true whether the distribution is tall (A)
or wide (B) or offset to a higher mean (C).
[The parametric mean and standard deviation are written µ ± ].