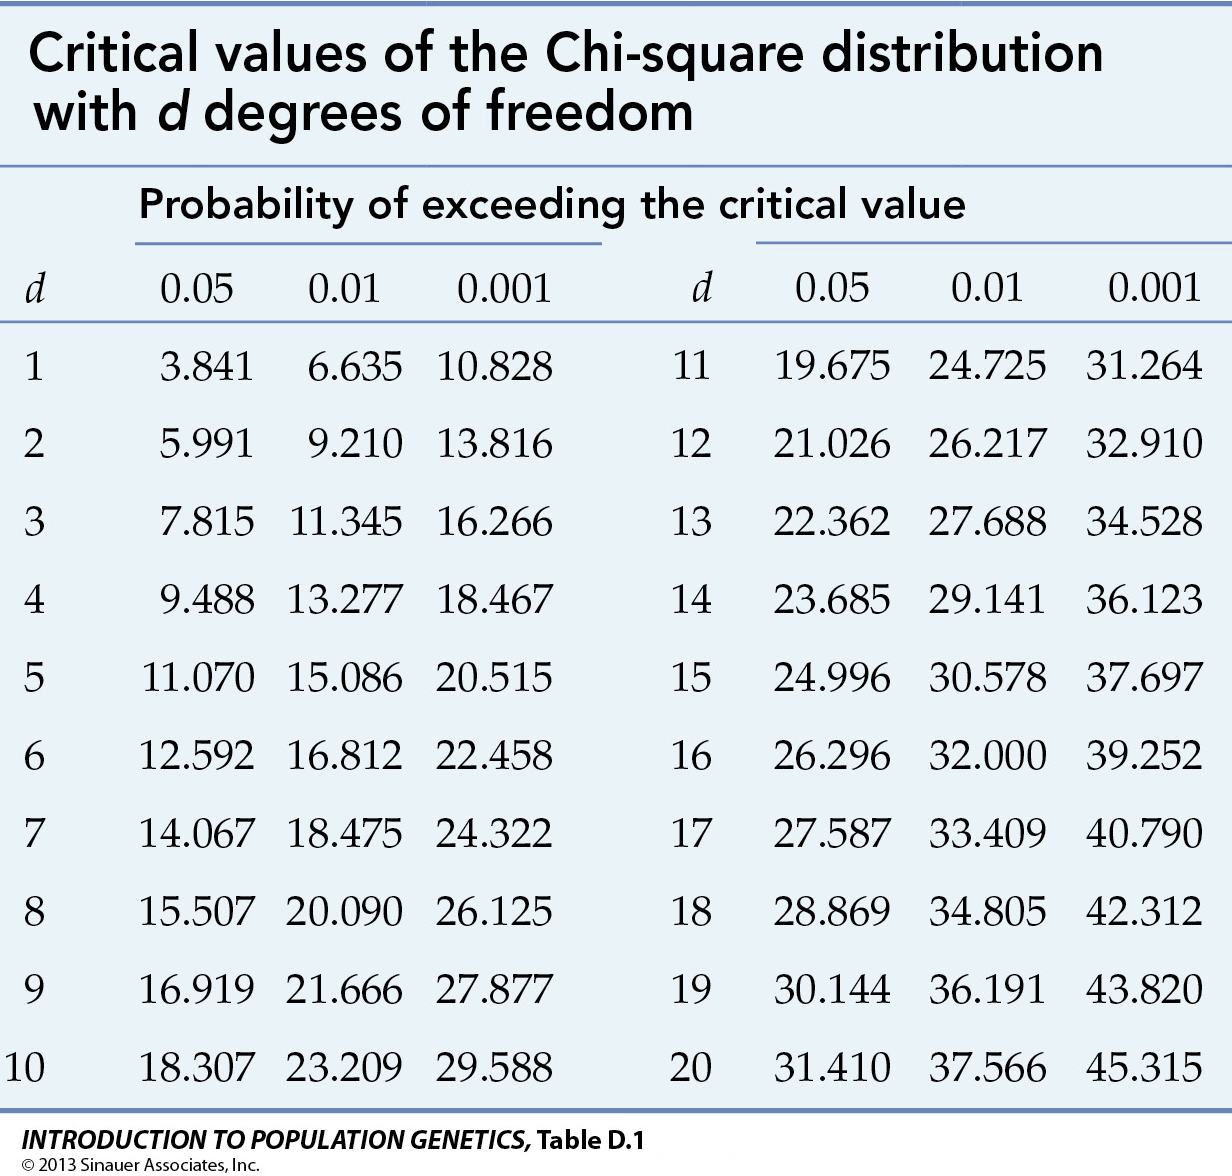
Critical values of the Chi-square (X2) distribution at p = 0.05, 0.01, & 0.001 for d = 1 - 20 degrees of freedom
The critical value of a
statistical test is the value at which, for any per-determined probability
(p), the test would indicate a result
that is less probable than p. Such a result is
said to be statistically significant
at that probability. In experimental biology, the
pre-determined value is typically p = 0.05,
which indicates a threshold of interest in a result that would
happen by chance only once in twenty trials. Under some
circumstances, the critical value may be set as p = 0.01
or 0.001, that is, the result would occur only once in
a hundred or a thousand trials; p may also be
reported as the
range or upper bound of the probability of the observed
result.
The other consideration is the number of degrees of freedom (d or df) in the data. Typically, if there are C categories of data, df = (C - 1). For a total of N observations distributed across C categories, the number of observations in any one category can be anything between 0 ~ N. The observations in the second category can be anything between 0 ~ (N - C1), and so on. The number of observations in the last category however is not free to vary, as it is fixed by N minus the sum of all previous category counts.
To evaluate the statistical significance of an experimental result with two categories (d = 1), note that the critical value of p0.05 = 3.841. If X2 = 2.0, the result would not be significant, and would be reported as p[0.05, df=1] = 2.0ns, where ns means not significant. A result of 5.0 would be significant at p < 0.05 (or 0.01 < p < 0.05), a result of 8.0 significant at p < 0.01 (or 0.010 < p < 0.001), and a result of 20.0 as p < or << 0.001. The three values might also be reported as 5.0*, 8.0**, and 20.0***, where the number of stars is a shorthand convention to indicate significance at 0.05, 0.01, & 0.001, respectively.
Table rearranged from © 2013 by Sinauer; Text material © 2022 by Steven M. Carr